Translate

Showing posts with label sensor. Show all posts

Saturday, July 7, 2018

Designing an HVAC monitoring system

Ideas - things to do

The HVAC (Heating, Ventilation and Air Conditioning) system, as many other systems, has the bad habit to broke down when most needed.

The idea is to design a monitoring system for HVAC capable to predict problems, with the less possible impact on the system, meaning that the monitoring system should be as much as possible independent from the HVAC itself.

Wednesday, May 10, 2017

Gnuplot on Raspberry Pi

gnuplot is a program capable to produce graphs starting from set of data.
Ideal to graphically represents sensor readings.

This article assumes to use Raspbian on a Raspberry Pi, specifically in my case the Raspbian version is the one used with Dexter for GrovePi.
Since GrovePi allows to easily connect sensors to the Raspberry, gnuplot is the perfect companion for that environment.

Installation


Simple, open a terminal and digit : sudo apt-get install gnuplot

That's it :)

Use

Once gnuplot is installed, is possible to open a terminal and digit the command gnuplot.
An interactive environment command line based will be available.
However the best way is to create a file containing the commands needed to generate a graph and have gplot reading that file to produce the graph as described in these instructions.

Data file


The file containing the data need to be in a specific format.

The time/date in the format of yyyy-mm-dd:hh-mm-ss (see the timefmt line in the command file), then the light value and (in this example) the voltage measured.
Each field is separated by a tab and each line ending with a newline (/r).

Example of data saved in the fhelper_datalogger.txt

# 2016-12-05:10-52-42 - Starting datalogger - time - light - volt 
2016-12-05:10-53-02 758 4.43
2016-12-05:10-53-24 758 4.43
2016-12-05:10-53-44 758 4.43
2016-12-05:10-54-05 758 4.43
..........................
..........................
..........................


Command file


Here an example of a gnuplot file (called testfile) used to display some information collected in the data file.
Specifically the goal is to create a graph showing the data stored in the second column of the file (light)
set title "fHelper light data vs. Time"
set datafile sep '\t'
set xlabel "Time"
set ylabel "Light"
set xdata time
set timefmt '%Y-%m-%d:%H:%M:%S'
set yrange [0:1000]
set style data line
set terminal png size 1500,800 enhanced font "Helvetica,20"
set output 'displight.png'
plot '/home/pi/Desktop/fhelper/fhelper_datalogger.txt' using 1:2
The file is taking a file called fhelper_datalogger.txt (located in the directory /home/pi/Desktop/fhelper) and will produce a file called displight.png.
The file will be saved in the same directory where this file exists and is executed.

To execute it just digit from the prompt : gnuplot testfile

Here a couple of examples of graphs obtained from the log file.
One shows the light reading and the other the voltage reading.
To obtain the voltage reading was enough to change a couple of lines from the command file.
Specifically I changed the Y axis range (0:1000 for light, 0:5 for Volt) and the plot command telling to use the first and third column in the file rather than the first and the second column (plot '/home/pi/Desktop/fhelper/fhelper_datalogger.txt' using 1:3)


Wednesday, November 16, 2016

5V Solar Power supply for Raspberry Pi - feasibility phase

Ok, here the deal.
The goal is to have a 5V solar power supply for Raspberry Pi in order to power up a project (fHelper).

Wednesday, October 8, 2014

Airflow sensor test

I used a little board with a MSP430-2013 and a LCD display  to develop the basic code to test and read the airflow sensor.

The circuit


Here a picture of the prototype


The software

The airflow sensor reading is based on counter and a timer.
The MSP430 pin connected to the airflow sensor is set in interrupt mode (rising) and after a check on the pin state to be sure is not a spike, a counter is incremented.
Every time a related timer expire, the value of the counter is copied into another variable (to be displayed) and the counter is reset.
I use another timer to display the read value on the display, after a integer-to-ascii conversion.
The code described is not reading the DS1820, only the airflow sensor.


Tuesday, August 26, 2014

Build an airflow sensor

For one of the projects I want/need to do, it was necessary to measure an airflow.
Here how I built a small sensor for that.

The simplest way to do so is to modify a computer fan.
I choose a small brush-less fan (for CPU), with ball bearings.

Circuit


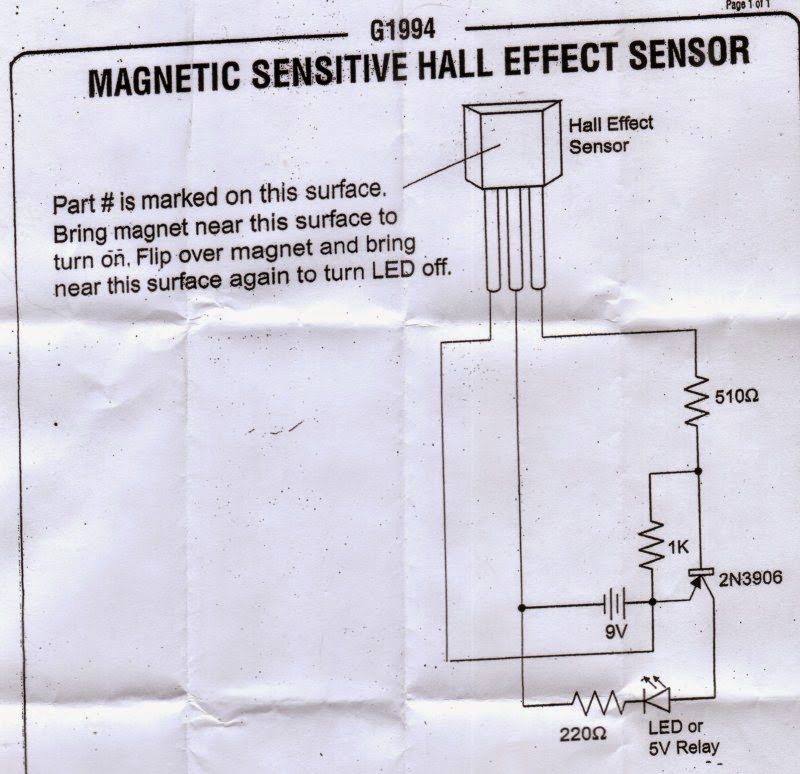
Probably the simplest and safest way to detect the rotation of the blade, is to use an Hall Effect sensor.
The sensor is placed inside the fan case, instead of the original motor circuit.
Below the bipolar Hall Effect sensor I used.  No really need to have a bi-polar Hall Effect, actually a single pole Hall Effect it would work better, but this is what I had around at the time.


Hardware preparation


The first step was to split the rotor from the  main case.
Usually there is a small groove that keep the rotor in place.
On the rotor, in this type of fan, there is the permanent magnet.
It need to be removed.

The motor is usually soldered to a PCB,  just stuck in the plastic case.
With some force is possible to disconnect it.
3 wires, as the original configuration of the fan, are required for the Hall sensor.
Vdd, GND and the output.

Here some pictures of the conversion, starting from the original CPU fan I used (below)


The first thing was to take it apart, removing the motor and electronic.


 Then I glued an Hall Effect sensor close to the shaft, on the base.


On the propeller, I attached two earth rare magnets (very small and very powerful), on the opposite sides.
I left the metal rim inside to facilitate the magnet attach (I also glued them) and to give a little bit weight to the propeller.


The magnets are attached with the poles in the opposite direction, because the Hall Effect sensor I used is a bipolar one, i.e. it needs to "see" a North/South pole change in order to go on, and a South/North pole change to go off.

Here the anemometer completed, attached to a simple circuit to test the Hall Effect sensor.


In the last picture, it is possible to see also the 1 wire temperature sensor  (DS18S20) connected to the cable.
It is the sensor needed to detect the temperature of the air flow.
A simple first prototype , using an MSP430-2013, it was built to develop and test the firmware to read the anemometer and the temperature sensor.